The Gordon Growth Model (GGM) helps you find the value of dividend stocks. With my GGM calculator, you can find if a stock is undervalued. I’ll show you the formula and examples below…
Gordon Growth Model Calculator
Try using my GGM calculator with different numbers. This can help you learn how it works. Small changes with your assumptions can have a huge impact on the estimated stock price.
When studying for the CFA exams, this formula was one of hundreds to learn. It ties into discounting future cashflows and many other concepts. Let’s take a closer look at what’s happening behind this calculator…
GGM Formula
Here’s one of my early YouTube videos that explains this model…
The video is a bit rough around the edges, but it can help with learning this finance concept. And here’s the Gordon Growth Model formula…
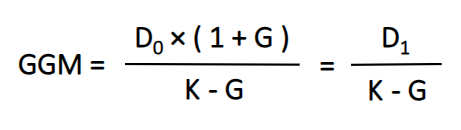
D0 is the current annual dividend yield. And sometimes you’ll see the Gordon Growth Model formula with D1 as the only value on top. By taking D0 times one plus the dividend growth rate, you’ll get D1. This is the expected annual dividend for the next year.
This dividend discount model assumes a constant rate of dividend growth into the future. That’s the G value in the formula. And investors often use a number close to long-term inflation rates. You might see roughly 2-3 percent.
The last input is K and that’s your required rate of return. For this number, you might see 8-10%. This is roughly the long-term average annual return of the stock market. Although, rates on government bonds and other opportunity costs can influence what number you use here.
Gordon Growth Model Examples
With the Gordon Growth Model calculator, follow along with this example…
Let’s say you have a stock that pays a $0.25 quarterly dividend. And for the annual dividend, we take that number times four. This gives us a current annual dividend of $1.00. This is D0 and let’s assume a constant dividend growth rate of 3%.
To get the estimated dividend for next year (D1), we take one plus 3% to get 1.03. We then take that number times the $1.00 dividend. This gives us $1.03 for the numerator.
At the bottom of the GGM formula, let’s use 10% as our required rate of return. So, we’ll take 0.10 minus 0.03 and that results in 0.07 for the denominator. The final step is taking 1.03 divided by 0.07 and this gives us an estimated stock price of $14.71.
If the real stock price is below this, you might have found an undervalued dividend stock. Although, there are many factors and assumptions with the Gordon Growth Model. And to adjust this example, assume only the dividend growth rate changes. If we bump it up to 5%, we get $21 for the estimated stock price.
Gordon Growth Model Assumptions
The Gordon Growth Model is a dividend discount model that assumes a constant rate of growth. But in the real world, dividend growth is rarely a constant rate of change. There are a few companies that have raised their dividend for 50+ years in a row. These are called Dividend Kings. And the list is bigger for Dividend Aristocrats (at least 25 years of consecutive dividend growth).
Companies can fall on tough times and dividend cuts are common in a downturn. And on the flip side, a great financial year might lead to big one-time special dividends. Costco is an example of a special dividend payer.
You can adjust the expected dividend growth based on your future expectations. And for a better margin of safety, I like to use conservative estimates. If a company has been raising its dividend at an average of 10% the past few years, I might use 4-5% in my GGM calculator.
The same is a good rule of thumb for your required rate of return. A higher number here will give you a lower estimated stock price. It can give you a larger margin of safety when investing.
However, Gordon Growth Model is a simple investment valuation tool. There are many complexities with a business and other factors to consider before investing.
DCF Modeling
Discount Cash Flow (DCF) modeling is a broader investing concept. You can map out a company’s growth and adjust estimated cashflows for each quarter or year. You can build in many assumptions and test different business and economic scenarios.
I used to do in-depth financial modeling but have moved towards a simpler approach. And this Gordon Growth Model calculator is one of many tools in my tool belt.
If you have any questions, please comment on any of my YouTube videos. And if you want to see where I’m investing my hard-earned savings, feel free to swing by my blog anytime. I’ll often share how I’m investing my savings.